Making sense of customer feedback with NLP
I met the head of quality while networking and told him I could turn six years of messy NPS comments into something useful, fast. Thousands of free-text answers, a dozen languages, shop-floor spelling. I built the pipeline that sorted them into praise and criticism, by theme and by country.
This one wasn’t my job. I was networking inside the company and got talking to the head of quality, part of the management team. He asked what I thought, and I told him: “hold up, I can turn this messy situation into valuable feedbacks in no time.”
The messy situation was six years of NPS surveys. Each one arrived as a score, a country, and a free-text comment, and there were thousands of them in a dozen languages, typed on shop floors with the spelling to match (“relibility”, “servise”, “sparepart” glued into one word). Real signal was in there. Nobody had split it by theme or reason, and nobody was going to read it end to end.
How I read it
First I handled the languages. Each comment was translated to English, simplified for the analysis, and its original language mapped back to a country, so the mining could run on one corpus while still knowing where every comment came from.
Then the cleanup, which had to survive shop-floor typing: lowercase, lemmatise, drop stopwords, spell-correct the whole vocabulary, and re-segment the glued-together words that defeat any dictionary that isn’t ready for them.
The core of it was letting the terms carry the score. Group comments by the n-grams they share, then read the statistics of those scores. A term with a high average sits in praise. A low average with a tight spread points to a systematic problem: the same complaint, over and over. A wide spread is a fight, the same words showing up in the 0s and the 10s.
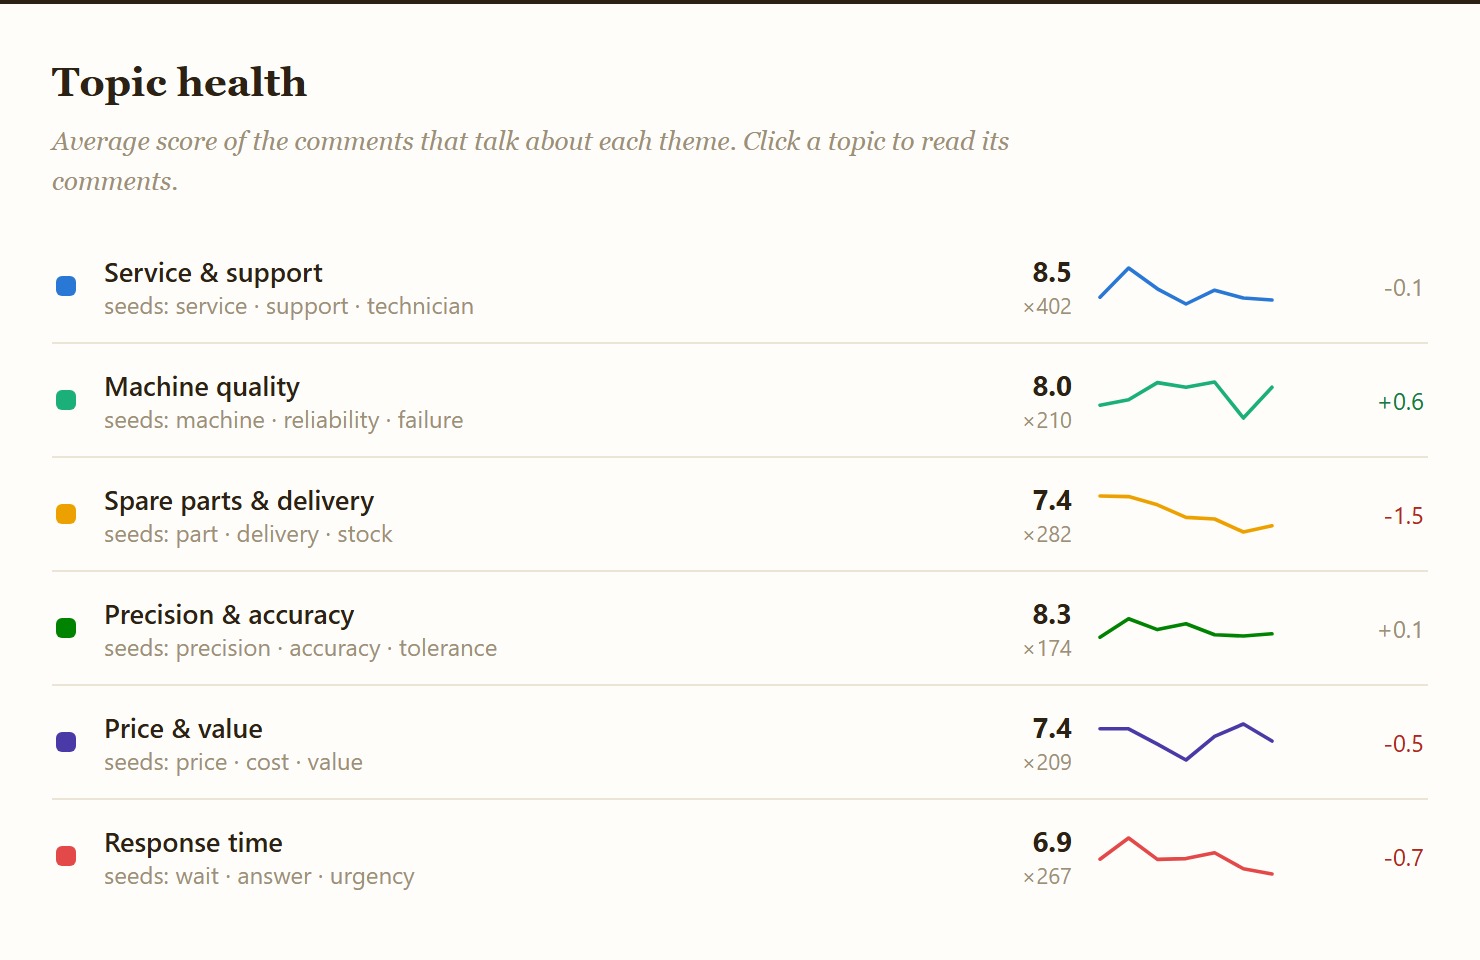
Nobody was going to hand-label thousands of comments, so each theme came from a handful of anchor words (service, price, precision, part) and semantic similarity did the stretching. Every term was scored against the anchors with WordNet path-similarity and spaCy word vectors, so “technician”, “hotline” and “callback” all pulled toward service without anyone listing them. A DBSCAN-and-k-means clustering pass ran alongside as a cross-check, to catch recurring situations the seed themes might have missed.
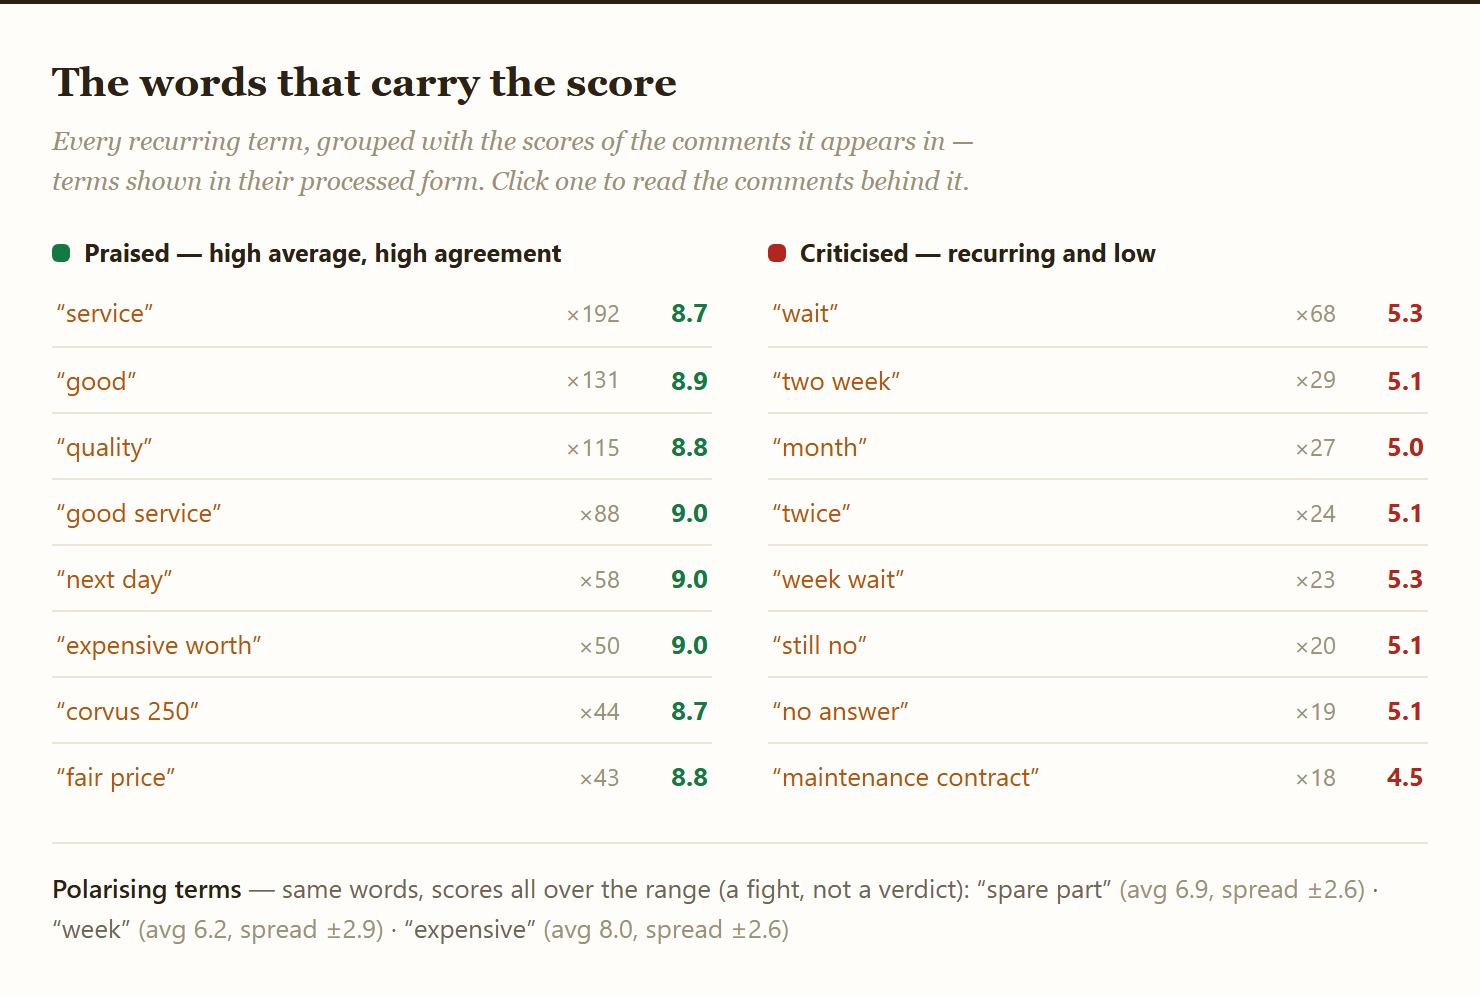
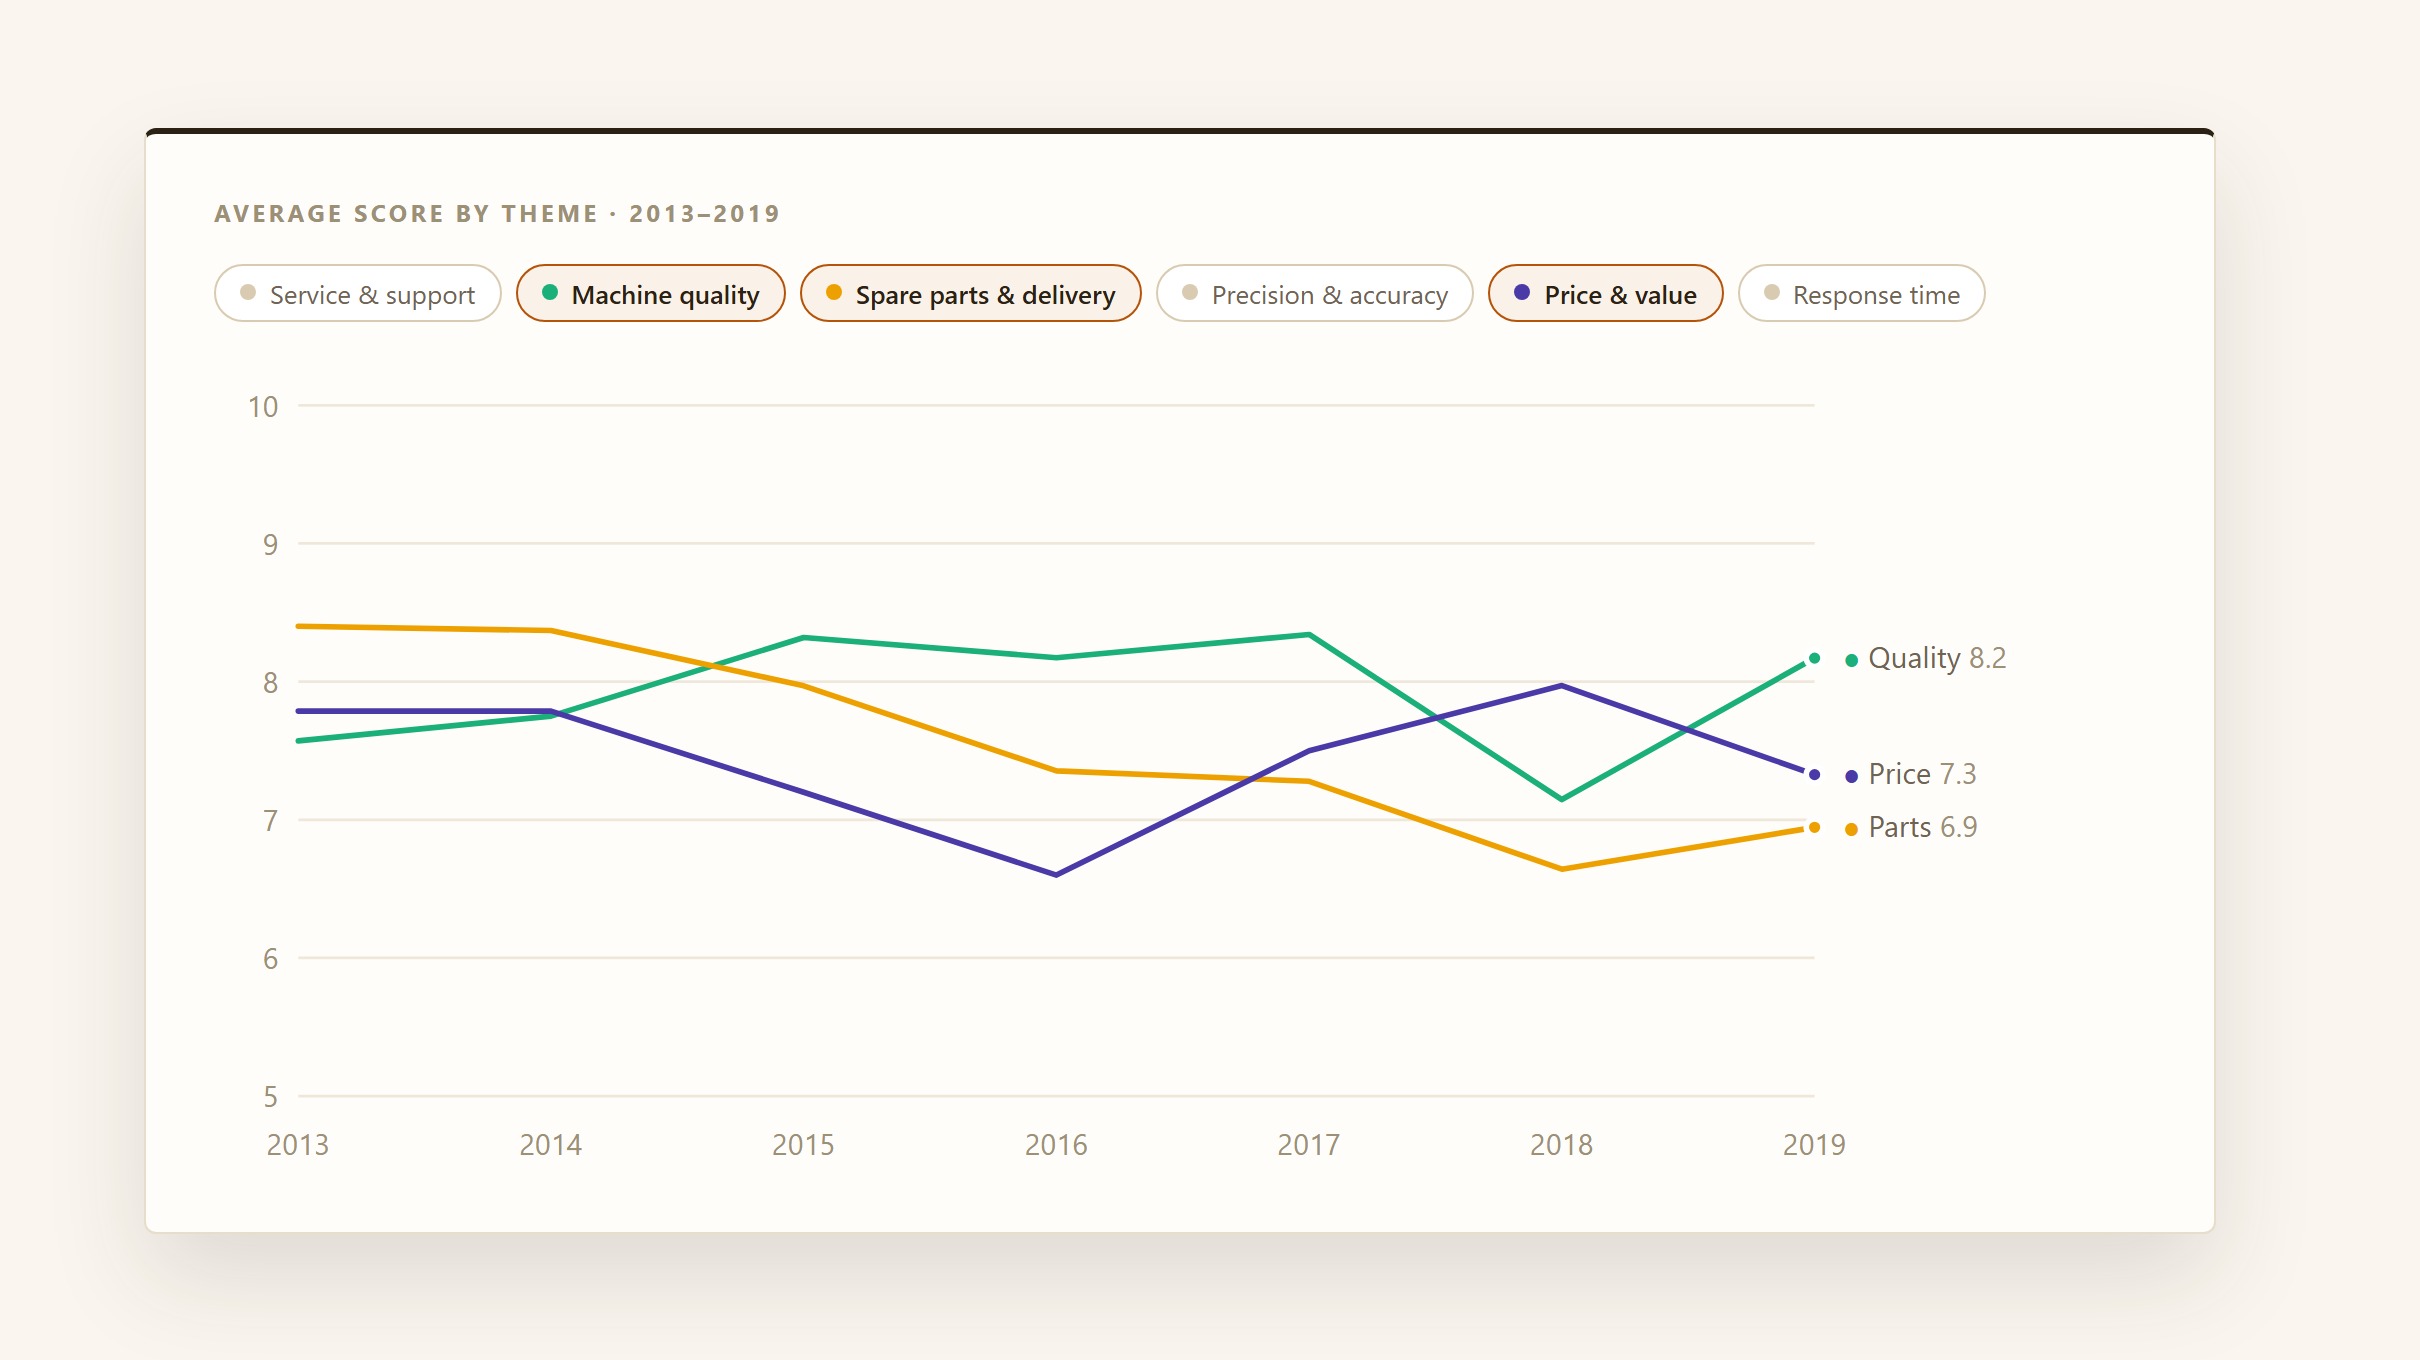
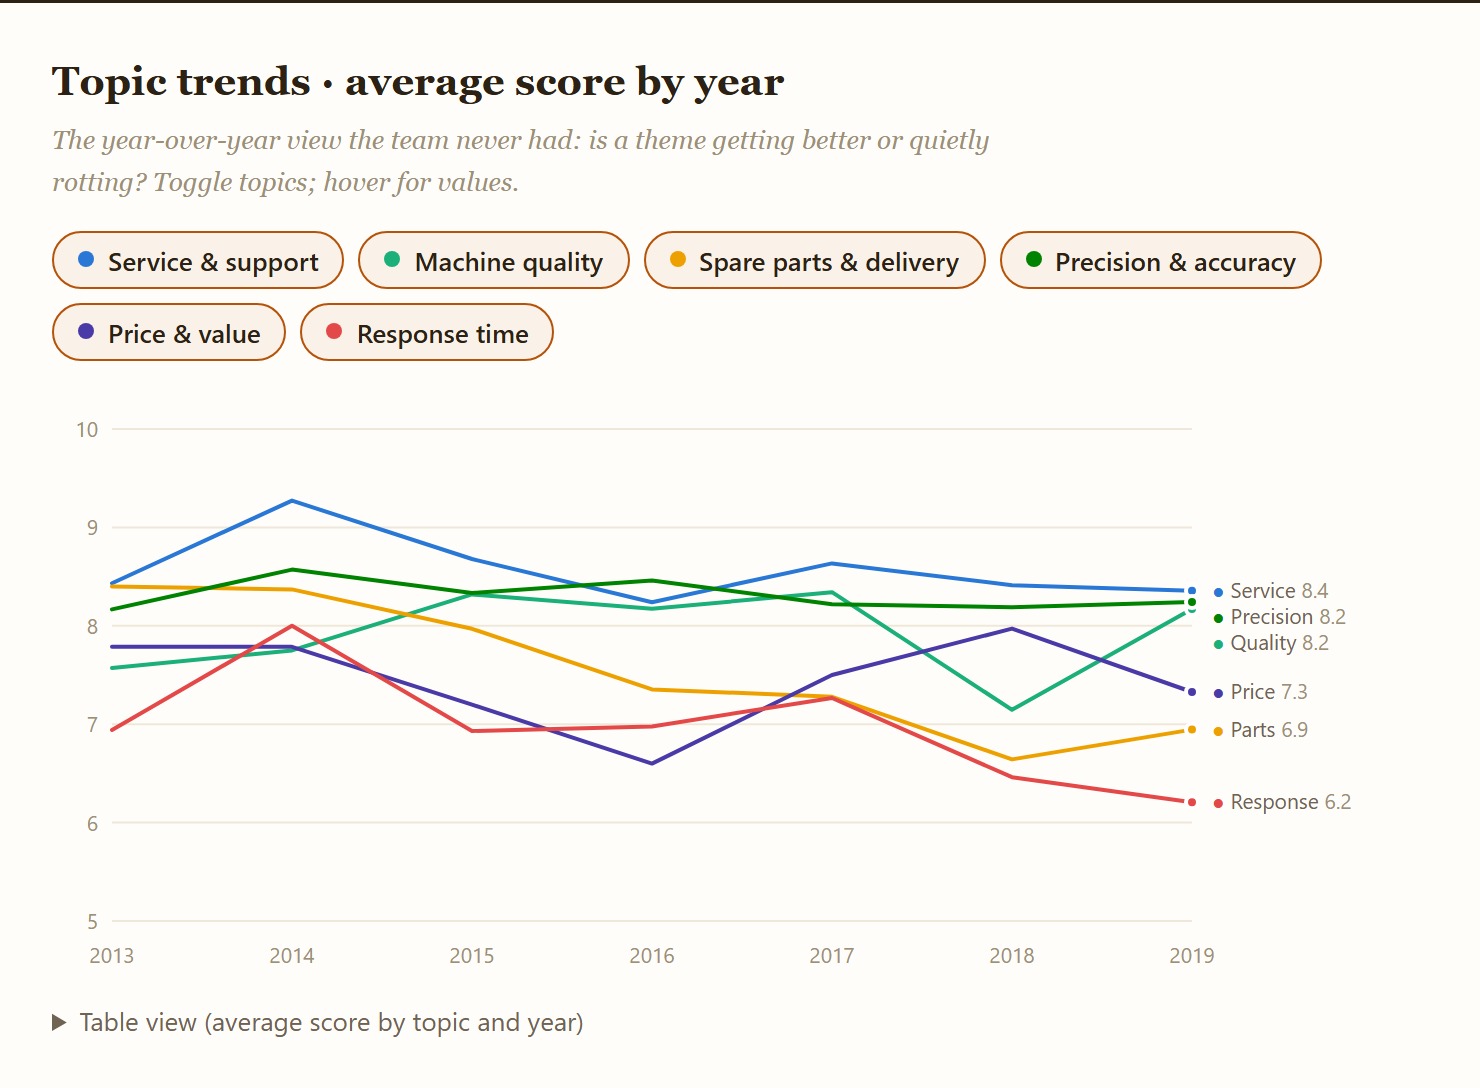
The trends came out clearly: which themes were slipping, which held, where one word hid two different experiences. I won’t claim more than that. I kept my head low and took little credit for it at the time. I was still naive.
See it working
The real corpus was confidential, so the demo runs the same pipeline on a fictional survey pile, generated in your browser. Filter by country and every figure recomputes; where a country has no slips for a given year, the trend lines connect straight across it. Open any slip to watch the pipeline take it apart, one step at a time.
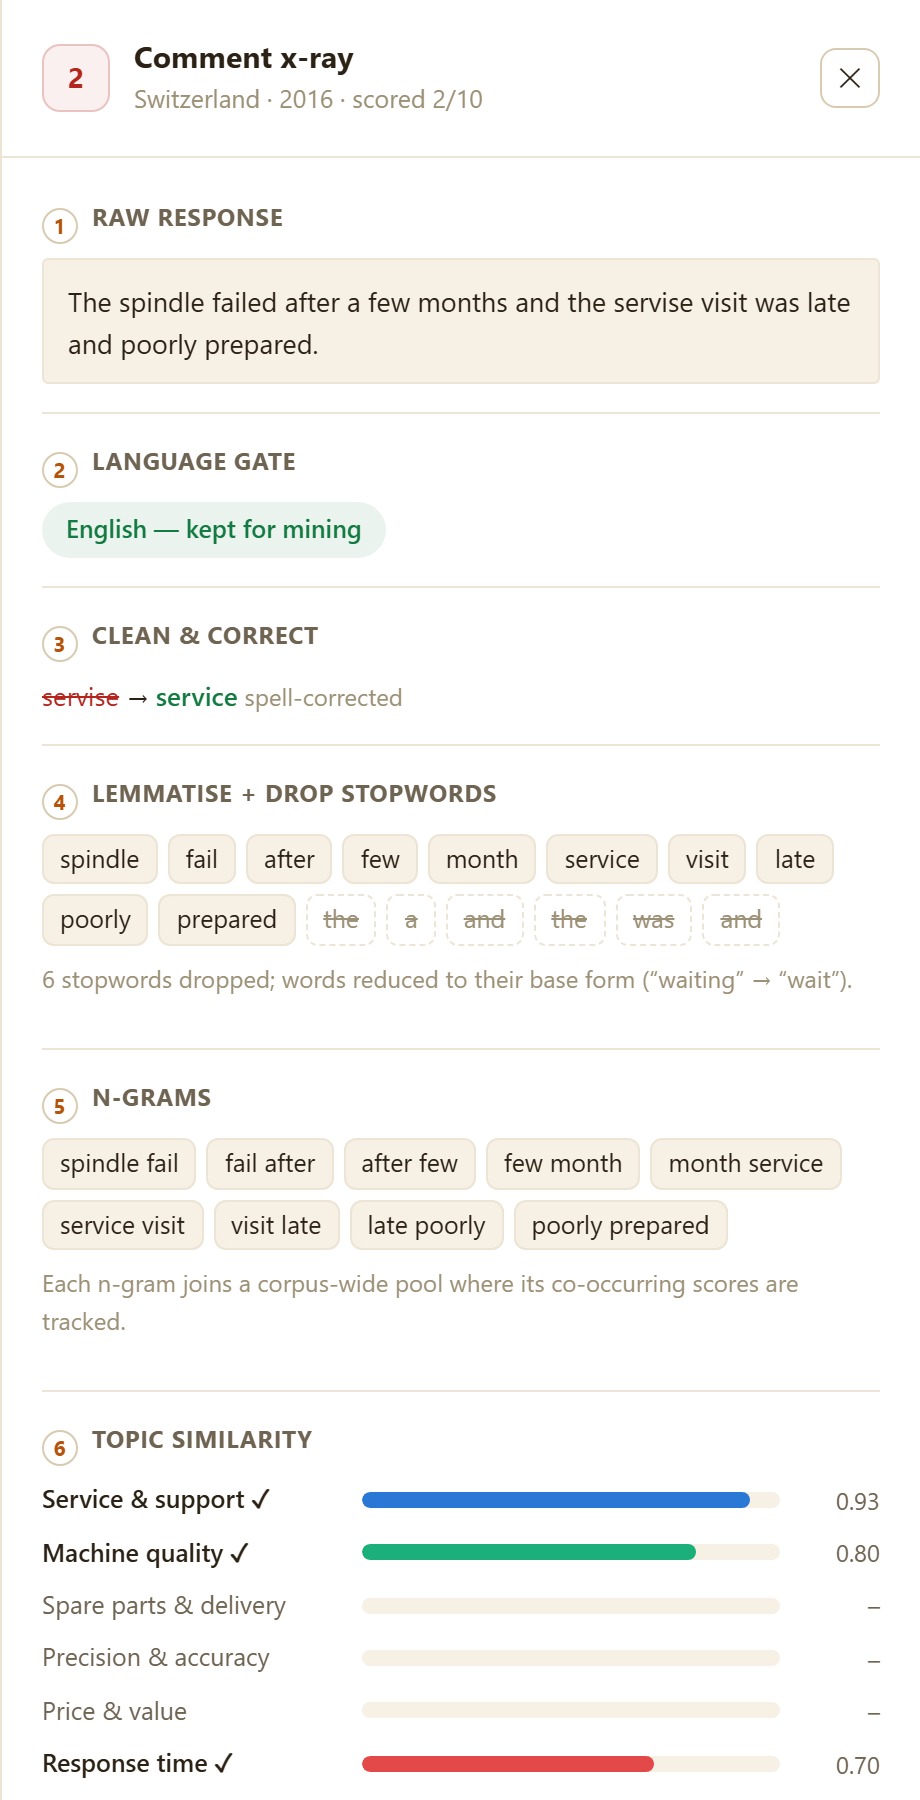
A fictional multilingual survey pile in your browser. Filter by country and the themes, scores and trends recompute; the trend lines now bridge years a country has no data for. Every comment and score is invented.
Result
The quality team got a view they never had: across the six years, where the company was praised and where it was criticised, by theme and by country, with a jump from any finding straight to the comments behind it.
The tool was built, and it was used. Taking it wider needed another team to pick it up, and that stalled. Then COVID happened, and I left, so I can’t tell you what came of it in the end.
If I did it again, I’d go straight to the managers whose areas the feedback named, put the tool in their hands, and write up how to collect feedback properly from then on. But the part I’m proudest of has nothing to do with the model. The whole thing started from a corridor conversation I wasn’t asked to have. The best value I’ve pulled out of a company has come from these bursts of initiative, and I think companies should invest in them.