Knowledge Graph — a 3D, self-growing map of what I've studied
A 3D, explorable knowledge graph built from 173 of my own Coursera lecture transcripts — 844 concept bubbles wired together with typed links, that a local LLM can grow, and where every AI edit is proposed, previewed and reversible.

Problem
Course notes rot in a folder. I take a lot of them — AWS, AI/ML, Snowflake — and they pile up as markdown files I never re-read. What I actually wanted was a map: something that shows how ideas connect, never loses a note as the pile grows, and stays readable even at 800+ nodes.
Three things a plain notes folder can’t do, and this had to:
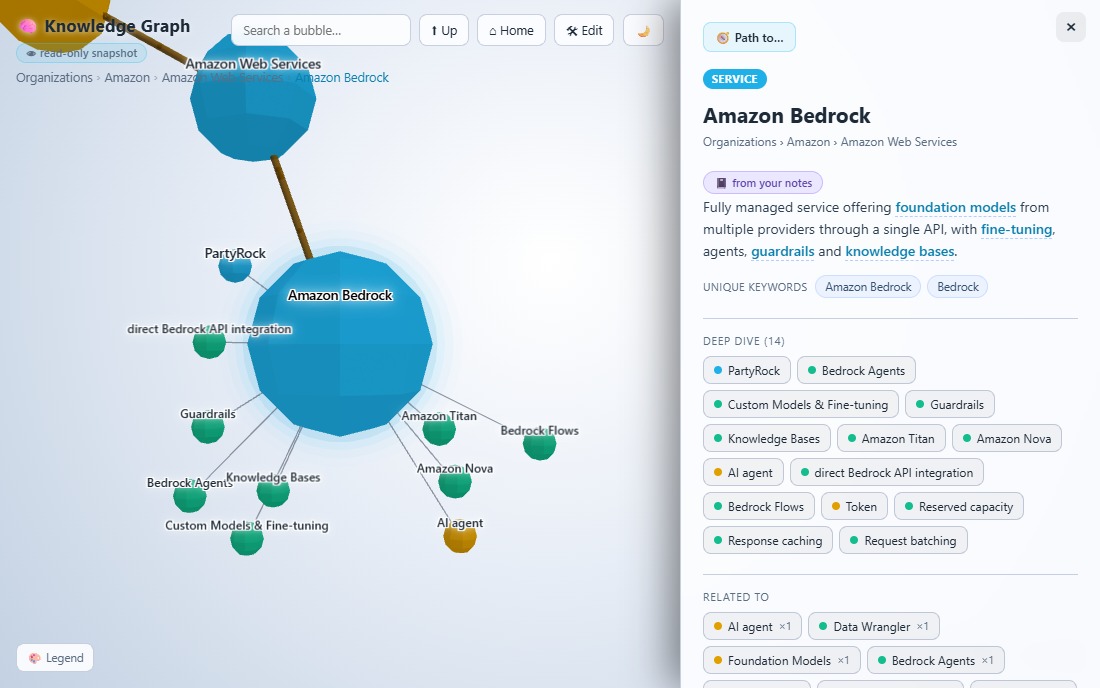
- Show how ideas connect. “Amazon Bedrock” should be the same bubble whether it came up in an AWS course or an AI-fundamentals one — not two disconnected mentions.
- Never lose anything. Every bubble has a parent, so nothing is ever orphaned — you can always reach it by drilling down or searching, even past 800 nodes.
- Stay readable at scale. A force-directed graph with 800+ nodes on screen is a hairball. This one only ever draws the focused neighbourhood — the path up to the root, what’s nested inside the current bubble, and its strongest lateral links — while the side panel still lists every connection in full.
It currently holds 844 bubbles and 1,636 links, distilled from 173 Coursera lecture transcripts.
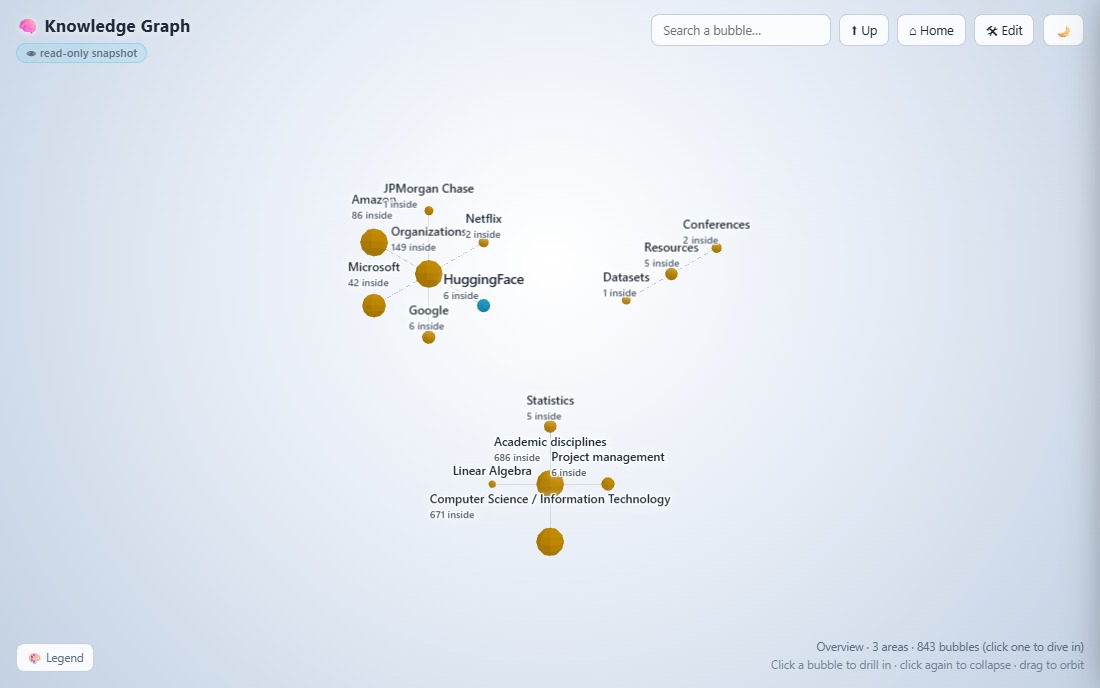 The overview: click a bubble to drill in, again to collapse, drag to orbit.
How it’s built
Ingestion, never touched twice. A Chrome extension captures Coursera lecture transcripts as I watch them and drops them into extracted/ as plain text. A processor (build-graph.mjs) then merges two structures: a hand-curated topic taxonomy — the provider → service → feature spine — and the document structure of the notes themselves (course → lecture → section). It scans every note for concept mentions to generate weighted explains and related_to edges. Bubble colour encodes type (provider, domain, service, feature, concept, course); link colour encodes the relationship — part of, explains, related to, used for, prerequisite of, alternative to.
Growth, with a trust boundary
A curated taxonomy only knows what I hand-listed, so a brand-new course on an unfamiliar topic would otherwise add lecture bubbles with nothing to anchor them. An optional pass sends new notes to a local, free, offline LLM (Ollama) that proposes new concepts and links.
The model never writes the graph directly. It emits proposals to a cache, and a merge step enforces the rules: curated nodes are immutable, cycles are impossible, invented types or predicates are rejected, and proposals with no resolvable parent land in a clearly-labelled Discovered branch instead of polluting the curated tree. The interesting engineering here isn’t “call an LLM” — it’s the boundary that lets an unreliable model expand a structure I trust without ever being able to corrupt it.
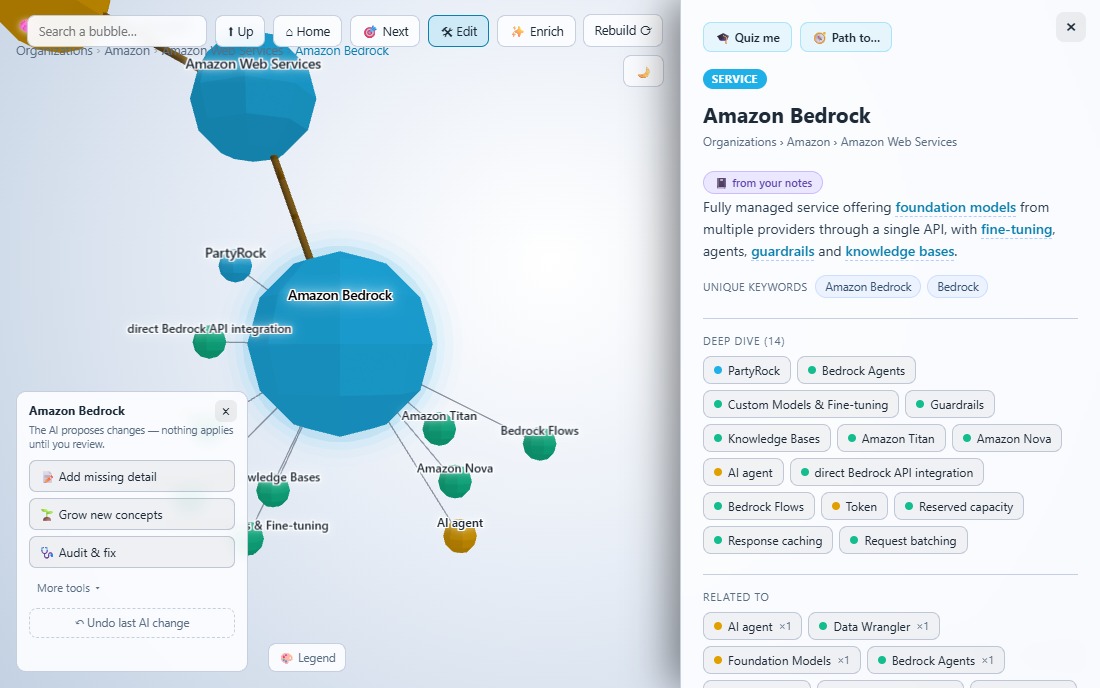
Editing is propose → preview → apply, always undoable
Every bubble carries AI tools — add missing detail, grow new sub-concepts, audit & re-home, merge, or a free-text instruction — but nothing lands until I review a diff-style preview and click Apply. One-click Undo reverts the last change, even across a merge. A “Quiz me” mode turns any bubble’s subtree into a short quiz generated straight from my own notes — a quick way to check what actually stuck.
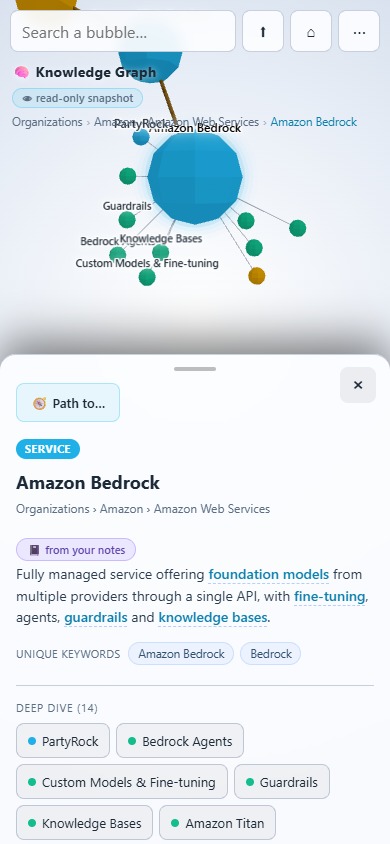
It’s responsive down to phone width: panels become exclusive bottom sheets, so only one is ever open at a time.
Two builds from one codebase
The tool ships in two shapes from the same front-end:
- Full app (for me) — navigation, search, quiz, path-finding and the AI editing panel, backed by a Node server plus local Ollama.
- Public snapshot (for anyone) — the same front-end plus a frozen snapshot of the graph as plain static files. The AI-editing panel stays visible on purpose, so a visitor can see exactly how I grow the graph — but it ships read-only: there’s no Node server or Ollama behind it, so every control is inert and nothing a visitor does can alter the snapshot. One self-contained folder that runs on any static host — free, and reachable from anywhere.
The live demo above is that public snapshot.
Stack
Zero-dependency Node.js server and build pipeline; 3d-force-graph (three.js) for the WebGL rendering, vendored so the app works fully offline; a local Ollama model for the optional enrichment pass; a Chrome extension for capture. No frameworks, no bundler.
Result
Instead of a pile of markdown I never re-read, my notes are a map I actually navigate — and one that keeps growing itself, safely, as I take more courses. 844 bubbles, 1,636 typed links, and a public snapshot anyone can explore.